SearchLight™ for iPad Help
Welcome to SearchLight!
We are proud to release a mobile version of our popular web resource designed for the research scientist working
in fluorescence microscopy or the optical instrument designer working on next generation fluorescence-based systems.
SearchLight allows you to easily select elements for your system, visualize the spectral properties, and quickly
calculate critical parameters such as signal brightness, autofluorescence levels, and signal-to-noise ratio.
With an intuitive interface one can easily test filter set compatibility with various fluorophores, see the effects
of changing system components (light sources, detectors, objectives), or create custom arrangements for a unique
application.
SearchLight contains an extensive library of 955 fluorophores,
214 light sources, 75 detectors,
and Semrock’s entire library of 864 filters and 144
optimized sets. You may also share sessions securely with collaborators or colleagues.
SearchLight can also save your results locally when offline and sync with the web version when you reconnect to the
web.
We hope you find this tool valuable and encourage you to send us an email and share your comments to
SearchLight@idexcorp.com.
System Requirements
SearchLight for iPad requires an iPad running at least iOS 9.
Layout
Screens:
SearchLight for iPad is comprised of two screens:
- Plot: Select from the extensive database of spectra for Filters, Filter Sets, Fluorophores, Light Sources, and Detectors.
and plot them interactively.
- Calculator: Evaluate absolute and relative signals (i.e., brightness or system throughput) and signal-to-noise ratios
(contrast) for an unlimited number of combinations of filters, fluorophores, light sources, and detectors.
Navigation:
- To switch to the Calculator screen from the Plot screen, touch the Calculator icon in the upper-left corner.
- To switch to the Plot screen from the Calculator screen, touch the Plot icon in the upper-left corner.
The Data Input section of the Plot view is a list of all available spectra. This list is updated automatically as Semrock adds new products to its database.
Available spectra:
- Filters: Select from all available Semrock catalog filters. Filter spectra are based on theoretical designs of Semrock filters. Design (rather than measured)
spectra are used to obtain the most accurate calculated results, since real measurement limitations and artifacts result in measured filter spectra that do
not accurately represent the true edge steepness and optical density of a fluorescence filter.
- Filter Sets: Select from all available Semrock catalog filter sets, including single-band bandpass and long-wave-pass sets and multiband sets.
- Fluorophores: Select from an extensive list of fluorophores. Spectra are sourced primarily from the University of Arizona
(www.spectra.arizona.edu) and Invitrogen (www.invitrogen.com).
- Light Sources: Select from a list of lamp, laser, LED, and other solid-state light source spectra. Spectra are based on manufacturer published data as well
as measured data.
- Detectors: Select from a list of commonly used detectors. Detector spectra are based on manufacturer published data.
Select spectra and load into SearchLight environment:
- Type in the search box above the spectrum types to quickly narrow the lists. Only items matching the entered text will appear.
- Touch the title bar of a spectrum type to expand the list of those spectra.
- Touch the up arrow next to the search box to collapse all the spectra lists.
- Touch the name of a spectrum in the list to preview (in light gray) the spectrum in the Plot Window.
- Touch the right arrow next to the spectrum name to add the spectrum to the Plot Window and Plot Legend.
Plot Window
Controlling the Plot Window:
- Pinch to zoom the plot in or out.
- Double-tap to zoom in
- Touch and drag to pan the plot.
-
Touch the gear icon above the plot in the upper-right or touch either axis to manually change the plotting range.
Modifying only the wavelength (x) axis:
The default wavelength range is 350 – 750 nm. The range can be expanded to as wide as 200 – 1600 nm.
- Touch the gear icon above the plot in the upper-right or touch either axis to manually change the plotting range.
Modifying only the spectrum (y) axis:
The spectrum axis can be viewed on a linear scale (Transmission, 0 – 100%, or Normalized, 0 – 1) or on a logarithmic scale (Optical Density, where
OD = – log10(Normalized value)). The default scale type is Transmission.
- Touch the radio buttons to the left of the Plot Window to switch among axis scale types.
Plot Legend
The Plot Legend is a list of all the spectra that have been loaded into the SearchLight environment from the Data Input lists. Once loaded, all of these
spectra are now available to be visualized in the Plot Window and added into Calculators.
Adding spectra to the Plot Legend:
- Touch the arrow to the right of the spectrum name in one of the lists in the Data Input section to add
the spectrum to the Plot Window and Plot Legend.
Controlling the Plot Legend:
- Show or hide a spectrum in the Plot Window by checking or unchecking its checkbox in the Legend. Show or hide all spectra
at once by touching the checkbox in the Legend header.
- Edit the appearance of an individual spectrum (or group of spectra for a Filter Set or Fluorophore) by touching the pencil icon
for that spectrum (or group). For each spectrum or group of spectra you can change the curve label, the curve color, the curve style
(line style and thickness), the curve opacity, and whether the curve is filled or not.
- Remove a spectrum from the Legend by touching its trash can icon. Remove all spectra at once by touching the trash can icon in the Legend header.
- View only the components from a given Calculator by selecting the Calculator name from the drop-down list in the Legend header, or by
touching the "Link to plot" button within that Calculator. View all spectra in the Legend by selecting "All" from the drop-down list.
Calculators
A SearchLight Calculator quantitatively computes the fluorescence signal, noise, and signal-to-noise ratio for unlimited combinations of filter sets, fluorophores, light
sources, and detectors. Calculations are based on a straightforward mathematical framework, which is described in detail in the white paper
Spectral Modeling in Fluorescence Microscopy. Besides
the main spectra, additional system input parameters include other spectrally dependent losses in the system, the collection efficiency of the optics, and characterization
of the fluorophores by quantum yields and decadic molar extinction coefficients.
The power of the SearchLight Calculator is that it enables quantitative evaluation of the compatibility of filter sets with fluorophores and other spectrally dependent
components of a system, analysis of crosstalk and bleedthrough, identification of optimal spectral edge locations for a set of filters under specific experimental conditions,
and guidance regarding labeling protocols in multiplexing imaging assays. These analyses can be simultaneously conducted on multiple system configurations by creating
multiple Calculators, thereby enabling multidimensional design-of-experiment analyses.
The Calculator assumes the following typical epifluorescence microscope configuration with spectral features described in detail below. The calculations are also applicable
to nonimaging systems, as well as to nonepifluoresence configurations. For example, it is not necessary to include the dichroic beamsplitter (when absent, its transmission
and reflection spectra are assumed to be unity for all wavelengths).
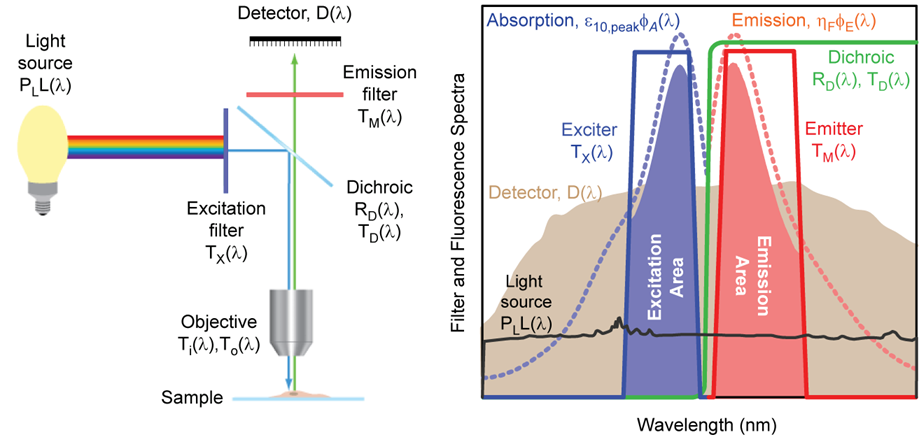
Schematic diagram of a typical epifluorescence microscope configuration based on optical filters (left), and examples of absorption and emission spectra
for a target fluorophore, transmission spectra for a set of optical filters, and light source and detector spectra (right). The light source (black) is a xenon arc lamp
with the detector response profile (brown) representing a typical (cooled) CCD camera. See
Spectral Modeling in Fluorescence Microscopy for
additional details.
Calculator Inputs
- Name: The name of an instance of the Calculator. The Calculator can be renamed by touching the pencil icon next to the name.
- Filter Set: The name of a 3-filter set. While an actual filter set can be comprised of multiple exciters and emitters, for the Calculator a set is assumed to consist of
a single exciter, a single emitter, and a dichroic beamsplitter. Selecting a filter set that is loaded into the Plot Legend automatically
populates the exciter, emitter, and dichroic that are associated with that filter set into the drop-down lists below. For multiband sets, by default the first exciter
and first emitter in the list are selected, but these can be changed.
- Exciter: The name of the excitation filter. This field is populated by default when a filter set selection is made. It is also possible to designate any individual
filter as an exciter, even when it is not part of a filter set. The exciter spectrum is represented as TX(λ) in the
diagram above.
- Emitter: The name of the emission filter. This field is populated by default when a filter set selection is made. It is also possible to designate any individual filter
as an emitter, even when it is not part of a filter set. The emitter spectrum is represented as TM(λ) in the diagram above.
- Dichroic: The name of the dichroic beamsplitter. This field is populated by default when a filter set selection is made. It is also possible to designate any individual
filter as a dichroic, even when it is not part of a filter set. The dichroic spectrum is represented as TD(λ) and
RD(λ) in the diagram above, corresponding to the transmission and reflection spectra of the filter, respectively. Only
transmission data is necessary to characterize the dichroic, since it is assumed that RD(λ) = 1 – TD(λ).
- Fluorophore: The name of the fluorophore. A fluorophore spectrum is comprised of two distinct spectra: the absorption spectrum and the emission spectrum. These spectra
are loaded by default into the Fluorophore Absorption and Fluorophore Emission fields when a Fluorophore name is selected. To load a custom fluorophore into the My Data
list in the Data Input section, it is required to load the (normalized) Fluorophore Absorption and Fluorophore Emission spectra as two separate data files. To provide a
Fluorophore DMAC, add the following header to the absorption file: # DMAC: <number>. To provide a Fluorophore Quantum Yield, add the following header to the
emission file: # Quantum Yield: <number between 0 and 1>.
- Fluorophore Absorption: The absorption spectrum of the fluorophore. This field is populated by default when a Fluorophore selection is made. The absorption spectrum is
represented as φA(λ) in the diagram above. It is normalized such that the value at the peak absorption wavelength is
equal to 1.
- Fluorophore Emission: The emission spectrum of the fluorophore. This field is populated by default when a Fluorophore selection is made. The emission spectrum is
represented as φE(λ) in the diagram above. It is normalized such that the value at the peak emission wavelength is
equal to 1.
- Light Source: The spectrum of the selected light source. For display purposes only, SearchLight automatically normalizes the displayed spectrum such that the peak value
is equal to 1. However, for calculations SearchLight normalizes the area under the curve so that the total power integrated over all wavelengths is equal to the value
entered in the Advanced inputs section of the Calculator. The Light Source spectrum is represented as L(λ)
in the diagram above.
- Detector: The detector spectral response profile. The detector spectrum is represented as D(λ) in the diagram above. For CCD and CMOS
cameras, the peak value of the detector response spectrum is assumed to be the peak quantum efficiency of the camera, whereas for all other types of detectors the spectrum
is normalized such that the peak value is 1. This normalization convention should be kept in mind when loading a custom Detector spectrum into the My Data list in the Data
Input section.
- Light Source Power (mW): The total power of the excitation light source integrated over all wavelengths. It is represented as PL
in the diagram above.
- Numerical Aperture: The Numerical Aperture (NA) of the objective lens which collects the fluorescence emission from the sample. The system is assumed to collect fluorescence
from the sample over a solid angle (in steradians) of
where n is the index of refraction (see below). Thus the fraction of total fluorescence emitted from the sample that is captured by the objective is
Ω / 4π.
- Index of Refraction: The index of refraction of the medium between the objective lens and the sample. See Numerical Aperture above to understand the impact of the index.
- Reflected Excitation Light Factor: An empirical factor introduced to take into account the amount of excitation light that is redirected from the excitation path into
the emission path (primarily by reflection off of the sample and its supporting glass). A default value of 0.07 assumes that 7% of the excitation light is redirected from
the excitation path into the emission path. This value is assumed to be independent of wavelength. It is represented by the factor ƒER
in the white paper.
- Transmitted Excitation Light Factor: An empirical factor introduced to account for the transmission spectrum of all other optics in the excitation light path. A default
value of 0.95 assumes that the optics in the excitation light path (with the exception of the exciter and dichroic) have 95% transmission. This value is assumed to be
independent of wavelength. It is represented by the factor Ti(λ) in the diagram above.
- Fluorophore Optical Depth (M cm): The product of the molar concentration of target fluorophore ("c" with dimensions of M = molar = moles/liter = 10-3 moles/cm3)
and the thickness of a slab of fluorophore ("d" with dimensions of cm). That is, Optical Depth = c×d. This term can be used to optimize the ratio of fluorophore labeling
concentrations in order to minimize bleedthrough, for example.
- Fluorophore DMAC (M-1cm-1): Maximum value of the decadic molar extinction coefficient (or decadic molar absorption coefficient, DMAC) for the target
fluorophore. This quantity is a property of the fluorophore and its value is normally available from the fluorophore manufacturer. SearchLight Calculator automatically
populates this value for the selected fluorophore when it is available in the associated data file. When this value is not available, it is assumed to be 80,000. The
fluorophore DMAC is represented as ε10,peak in the diagram above. Note that Fluorophore DMAC × Fluorophore Quantum Yield is a measure of the brightness
of a fluorophore.
- Fluorophore Quantum Yield: The Quantum Yield for the target fluorophore. This quantity is a property of the fluorophore and its value is normally available from the
fluorophore manufacturer. SearchLight Calculator automatically populates this value for the selected fluorophore when it is available in the associated data file. When this
value is not available, it is assumed to be 0.5. The Quantum Yield is represented as ηF in the diagram above. Note that
Fluorophore DMAC x Fluorophore Quantum Yield is a measure of the brightness of a fluorophore.
- Autofluorescence Light Factor: An empirical factor introduced to take into account the relative strength of autofluorescence signal to the desired fluorescence signal. Its
recommended value should be between 0 and 1. The default value of 0.1 assumes that the autofluorescence signal strength is 10% of the desired signal. This value is assumed
to be independent of wavelength. Examples of sources of autofluorescence in imaging systems include the sample and its supporting glass, the primary objective and other lenses,
optical filters, and any other optical elements. The Autofluorescence Light Factor is represented as ƒAF in the white paper.
- Transmitted Emission Factor: An empirical factor introduced to account for the transmission spectrum of all other optics in the emission light path. A default value of 0.95
assumes that the optics in the emission light path (with the exception of the dichroic and the emitter) have 95% transmission. This value is assumed to be independent of
wavelength. It is represented by the factor To(λ) in the diagram above.
Calculator Outputs
- Fluorescence Signal (mW): The total desired fluorescence signal that reaches the detector (just before the photons get converted to electrons). Note that the light input
to the Calculator is expressed in mW and therefore the signal output is also expressed in mW. The Signal is represented by S in the white paper.
- Excitation Light Noise (mW): The undesired noise power that reaches the detector and which results from transmission and reflection of the excitation source light through
the system, including reflection off of the sample as quantified by the Reflected Excitation Light Factor. This quantity is very sensitive to the overlap and edge
steepnesses of the excitation and emission filters as well as the level and extent of out-of-band blocking in these filters. It is represented as
NE in the white paper.
- Autofluorescence Noise (mW): Total noise power that reaches the detector and which results from undesired autofluorescence. It is represented as
NAF in the white paper.
- Signal-to-Noise Ratio: The optical signal-to-noise ratio (SNR), equivalent to the Fluorescence Signal divided by the sum of the Excitation Light and Autofluorescence Noise
values. Note that the calculated SNR takes into account only the optical signal and sources of optical noise. The calculation does not account for electrical noise which
results when photons are converted into electrons in an actual detector (shot noise, dark counts, etc.). To compute the signal-to-autofluorescence-noise ratio only, simply
set the Reflected Excitation Light Factor to 0. To compute the signal-to-excitation-light-noise ratio only, set the Autofluorescence Light Factor to 0.
Calculator Output Summary
Calculator Controls
- Split Screen: When toggled, a Plot is displayed above the list of Calculators.
- Link to plot: When this button is checked in a given Calculator, only the inputs from this Calculator are checked in the
Plot Legend and displayed in the Plot Window. The button may be checked in only one Calculator at a time. Checking this
button is equivalent to selecting a Calculator name from the drop-down list in the Plot Legend header.
- Normalize other Calculators relative to these values: For most practical cases there is insufficient system knowledge to obtain accurate absolute values for Signal and Noise,
yet relative comparisons among different filter-fluorophore-component spectra combinations can be highly accurate. By checking this button in a particular Calculator, the
values for Signal, Excitation Light Noise, etc. in all other Calculators will be normalized to their respective values in the Calculator with the button checked.
Session Management
A unique and powerful feature of SearchLight is the ability to save each of your SearchLight sessions so you can revisit your work at a future time or share it with your
colleagues. A session includes the spectra loaded into environment, the Calculators, and the current state of the Plot and Legend.
In order to use the session management features (Open, Save, Save As, and Share), you must be logged into your Semrock Account. Setting up an Account takes only
moments and requires minimal personal data. The Account is identical to the account used for online quoting and ordering (using the shopping cart) of optical filters at
www.idex-hs.com.
Don't have an Account yet? Create an Account now.
Loading, Saving, and Sharing sessions:
- Login to your Semrock Account (or establish a new one) to enable the session management tools. The Login screen can be reached by touching the menu icon in the upper-right
of the screen. Your login status will last indefinitely if "Keep me logged in" is selected.
Once logged in, you will have access to the following Session Management tools:
- New Session: Abandon the current session and start a new one.
- Open: Open a saved SearchLight session to pick up right where you left off. Sessions saved to your account from the online version of SearchLight will be available as well.
- Save: Save a SearchLight session to allow for later retrieval of the unique combination of spectra you loaded into the Plot Window and Plot Legend sections, including
all the controls applied to the Window and Legend, as well as the Calculators which were set up in that session. Sessions saved from the mobile application will be added
automatically to your online SearchLight account.
- Save As: Already have a session saved but want to make changes without overwriting the session? Save As a new session name to keep the original data as well as a new version.
Acknowledgements
Fluorophore spectra are sourced primarily from www.spectra.arizona.edu and from Invitrogen Molecular Probes division
(www.invitrogen.com). The SearchLight team acknowledges the efforts by George McNamara to compile an extensive database of fluorophore
and light source spectra and make them freely available to the community. We also gratefully acknowledge the valuable feedback from our beta testers of SearchLight.
Privacy
IDEX Health & Science Privacy Policy
Semrock does not share or sell personal information or data.
Disclaimer
SearchLight is for research use only and is not intended to be used for diagnostic or therapeutic purposes.
Copyright
Copyright © 2001 – 2012 Semrock, Inc, a Unit of IDEX Corporation. All other non-Semrock brands and product names used within this tool and its supporting resources are trademarks
of their respective companies.
Contact the Semrock team responsible for SearchLight at SearchLight@idexcorp.com with your questions and comments.